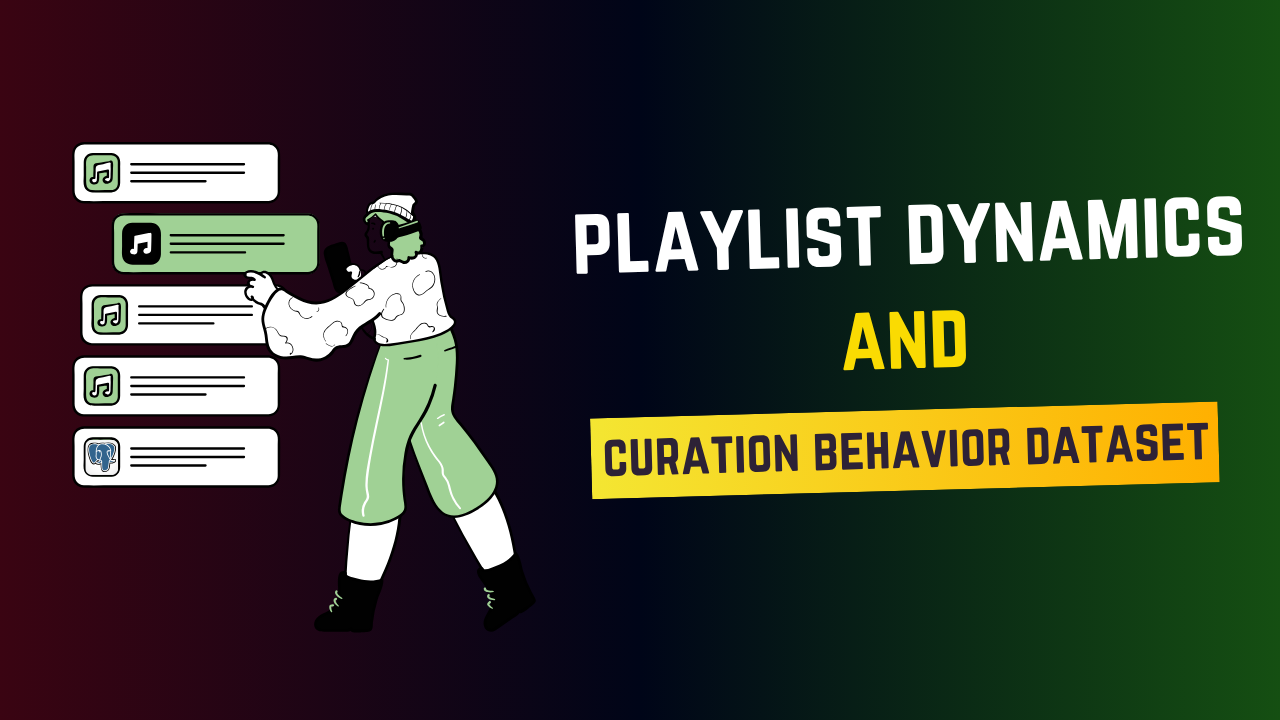
User Behavior & Engagement Analytics Dashboard Using Power BI
Group Category: Business Requirement
Product Category: BI Reporting & Analytics
Sub Category: Power BI
Discover platform usage trends and behavioral insights with rich Power BI visualizations.
Business Overview:
User Behavior & Engagement Analytics Dashboard Using Power BI empowers analysts, product managers, and data learners to understand how users interact with digital platforms. Designed around a structured PostgreSQL schema of a music streaming app, this hands-on product helps you build dashboards that reveal listening patterns, playlist trends, user retention, and cohort behavior. It's ideal for growth teams seeking to optimize engagement and for learners aiming to sharpen their dashboarding and data modeling skills in Power BI.
Product Highlights:
- A comprehensive Power BI guide focused on behavioral analytics with 5+ visual template
- Covers cohort analysis, playlist engagement, retention curve, and daily usage trends
- Uses real-world normalized tables (users, playlists, listening history, etc.)
- Built for aspiring Power BI developers, data product managers, and UX researchers
- Strong portfolio asset showcasing time-based behavioral modeling and interactivity
Learning Outcomes:
By completing this product, you will:
- Learn how to model user behavior datasets in Power BI
- Create KPIs and visualizations using DAX and relationship modeling
- Build engagement dashboards with slicers, drill through, and filters
- Apply time intelligence to derive retention and cohort curves
- Use behavior data to inform product growth, retention, and personalization decisions

user_listening_history
| CSVThis file logs every song play by users, capturing granular listening behavior with timestamps.
- Provides the primary fact table for analyzing user engagement over time
- Enables visualization of daily/weekly activity, peak listening times, and retention trends
- Supports cohort analysis by combining with
users.csv - Core for deriving metrics like active users, sessions per user, and churn behavior
playlists
| CSVThis file captures user-created playlists, including playlist titles, descriptions, creators, and timestamps.
- Helps analyze playlist creation trends and user content contribution
- Allows identification of top playlist creators and time-based creation patterns
- Core to assessing user engagement via content generation
- Connects to
playlist_songs.csvanduser_playlist_follows.csvfor full playlist insights
playlist_songs
| CSVThis file maps songs to playlists, indicating the song count and content depth of each playlist.
- Enables calculation of average songs per playlist and playlist completeness
- Supports playlist quality evaluation and user content enrichment
- Combines with playlist metadata to assess engagement from both creation and consumption perspectives
user_playlist_follows
| CSVThis file tracks user follow activity on playlists, identifying engagement with curated content.
- Enables identification of most followed playlists and top-engaged users
- Supports metrics like playlist popularity and creator influence
- Useful for assessing user preferences beyond active content creation
users
| CSVThis file contains account-level user data, including subscription type and registration date.
- Enables segmentation of users based on account type (Free vs Subscribed)
- Powers cohort analysis by registration timestamp
- Supports tracking user participation in playlists and listening events
- Connects with listening history, playlists, and playlist follows to form a complete engagement graph

$10.00 $4.99 50% OFF
About this Dataset:
Similar Products


Read All The Top User Reviews
Loading ratings and reviews...
No reviews yet
Be the first to review this product!
Error loading reviews
Please try refreshing the page.